Today, we are going to talk about creating charts like data bars in cells using formulas. We want to create something like this (Fig. 1)

Let’s start with creating a proper formula. We have to use the REPT (repeat) function. It will repeat a text, one or more chars, as many times as we write in the second argument. Let’s start with a pipe (a vertical line). We want to repeat it as many times as there are sunny days in a given month. Our formula looks like this (Fig. 2).
=REPT(“|”,B2)

After entering and copying down, we have data bars. However, the distance between individual signs is too big (Fig. 3)

We have to narrow it by using, e.g. a different font that works with this sign. We are selecting our data bars and changing the font name to Script (Fig. 4). Now, it looks much better.

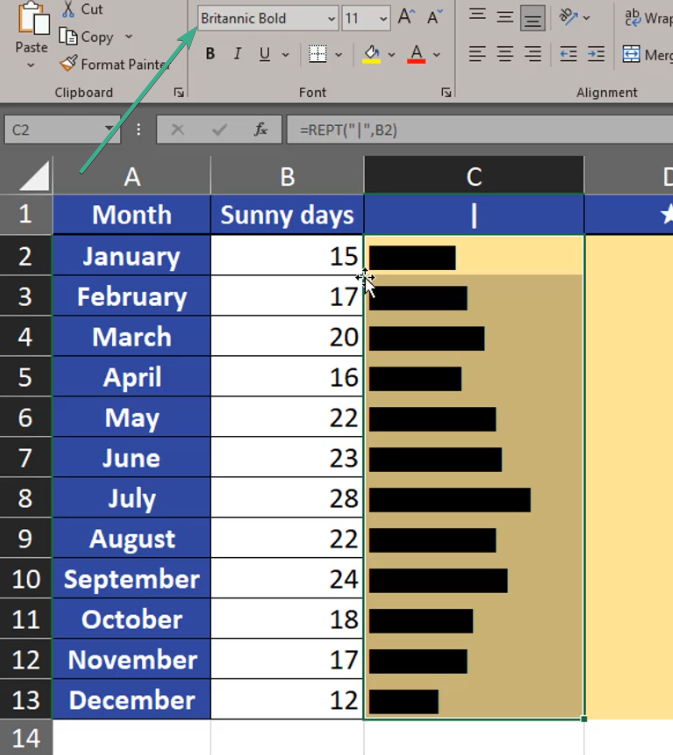
Let’s try, however, a different font. With Britannica Bolt, the signs look like real data bars (Fig. 5).
Let’s take the last example, which is the Haettenschweiler font. In my opinion, it looks the best, so I’m staying with this one (Fig. 6)

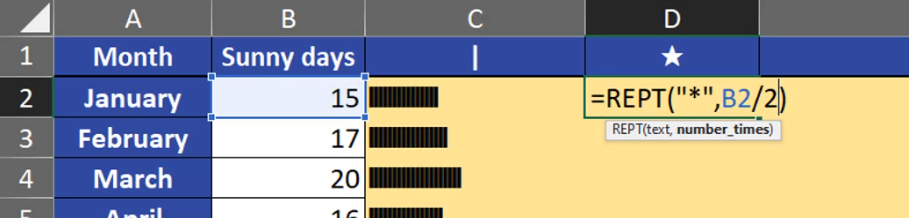
Apart from repeating a pipe, we can repeat other signs. If they are wider than the pipe and if the number of repeats is too big, we may have a problem (Fig. 7)
=REPT(“*”,B2)

We can see, that the asterisk string is too long (Fig. 8)

The solution is dividing the number, and the REPT function will only look at the integer part of the number. Let’s divide our numbers safely by two (Fig. 9).
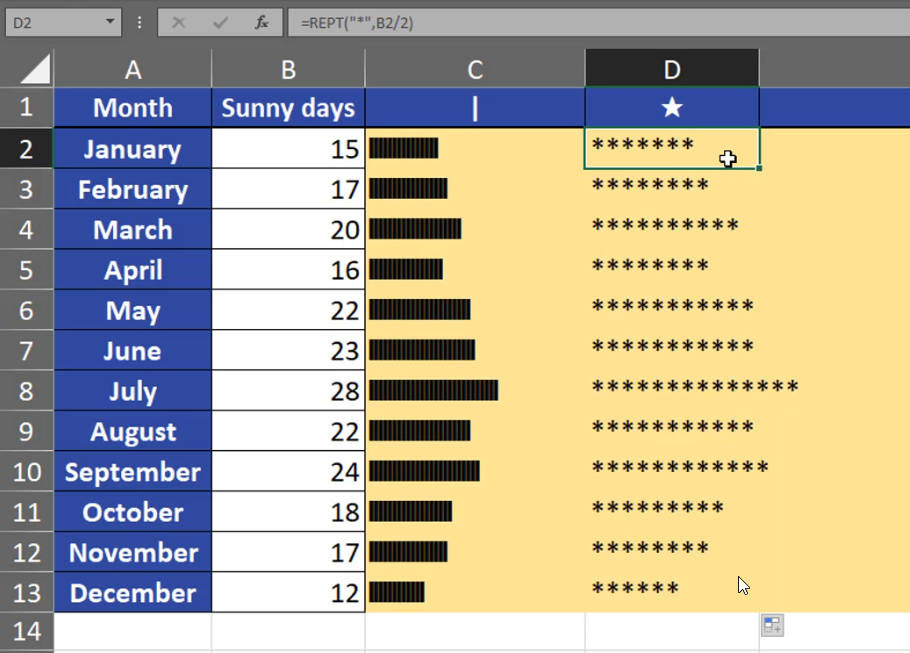
=REPT(“*”,B2/2)
When there is a smaller number of repeats, it looks quite good (Fig. 10)
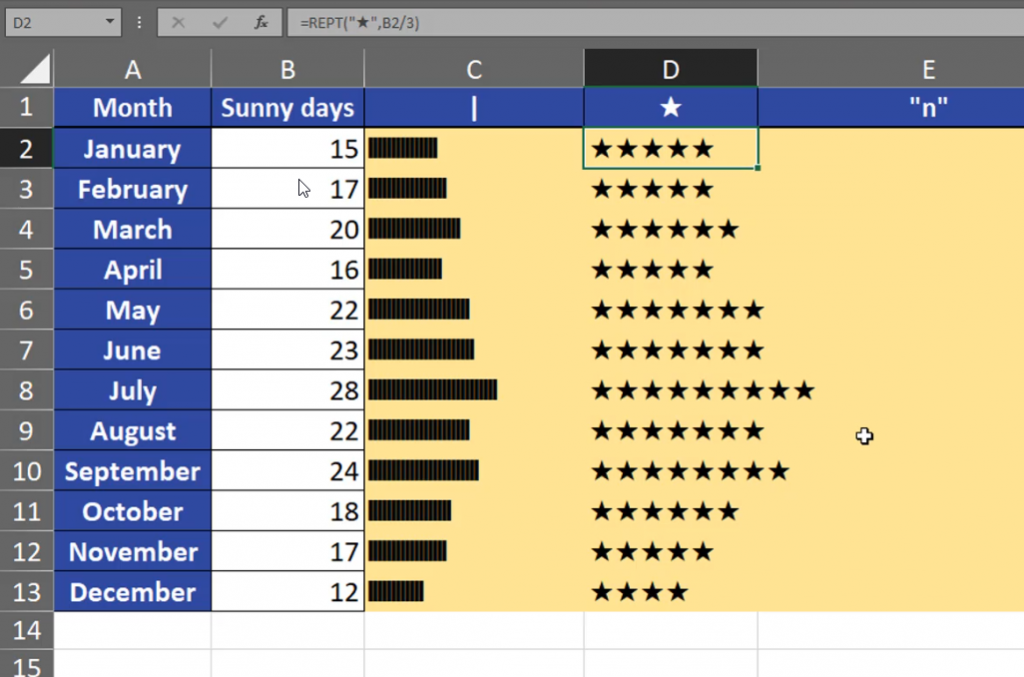
We have to remember that an asterisk is a simple sign, and we can use whatever sign we like. Let’s take, for example, a star (Fig. 11)
=REPT(“★”,B2/2)

We can see that the strings are very long (Fig. 12). We can divide them by even a greater number, e.g. 3.
=REPT(“★”,B2/3)

After putting the formula, it looks good (Fig. 13).
In our last example, we are going to repeat the letter n (Fig. 14)
=REPT(“n”,B2/3)
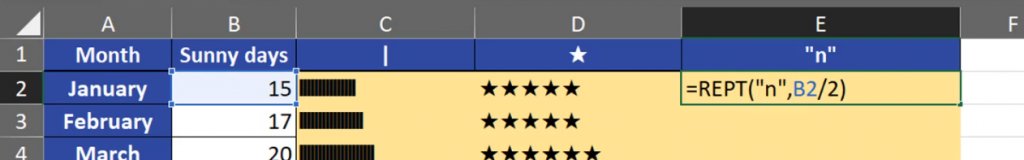
Now, we can see many ns (Fig. 15)

However, we can change our font into Windings, and the letter n changes into squares, which looks quite good as data bars (Fig. 16)
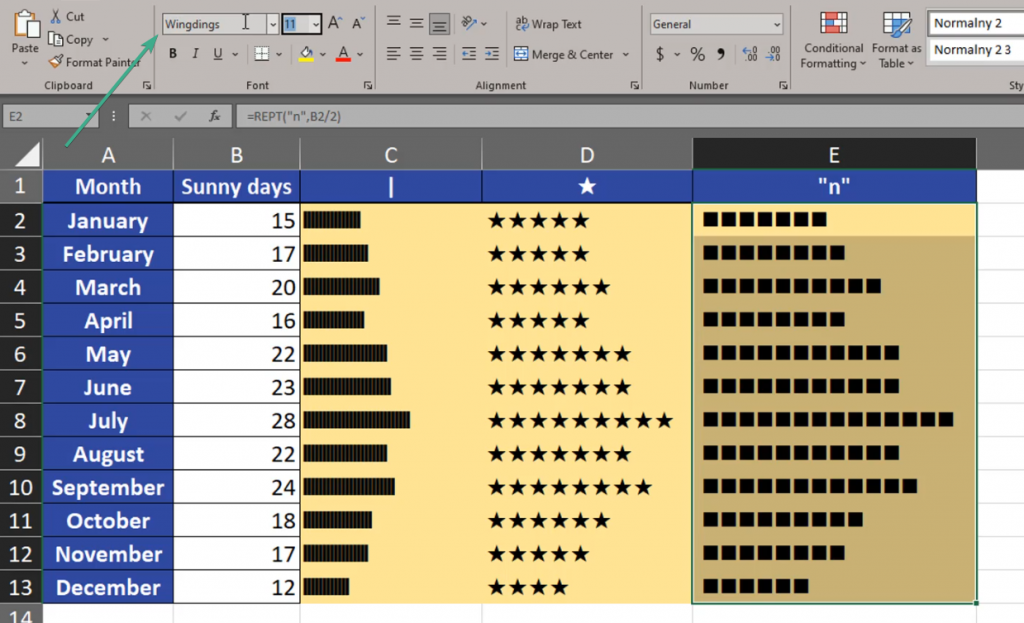
Summing, up, when we use different signs and different number of repeats, we can create quite good data bars using a formula.